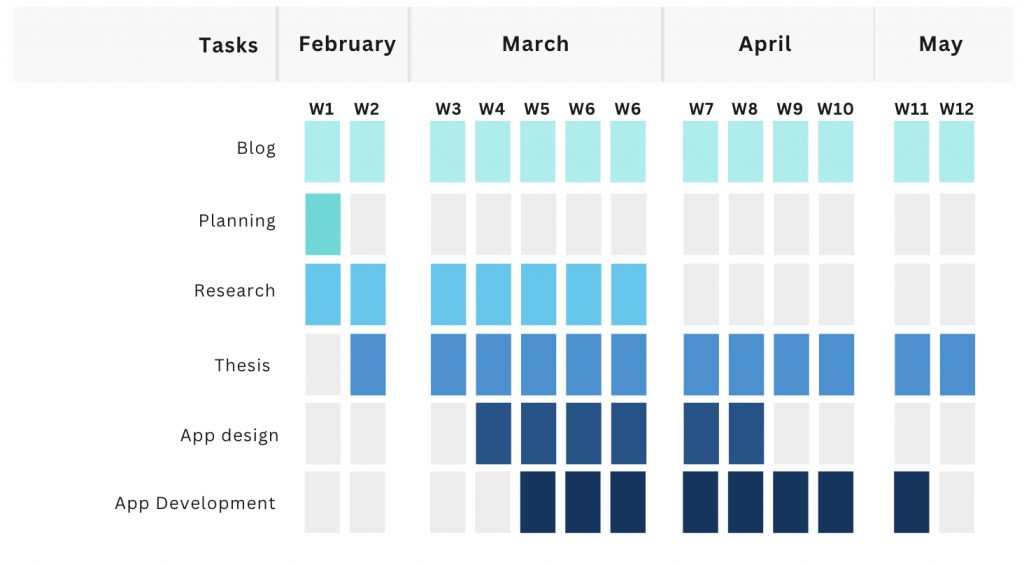
When I first started this project, I put together a very basic Gantt chart to help me visualise what needed to be done and when
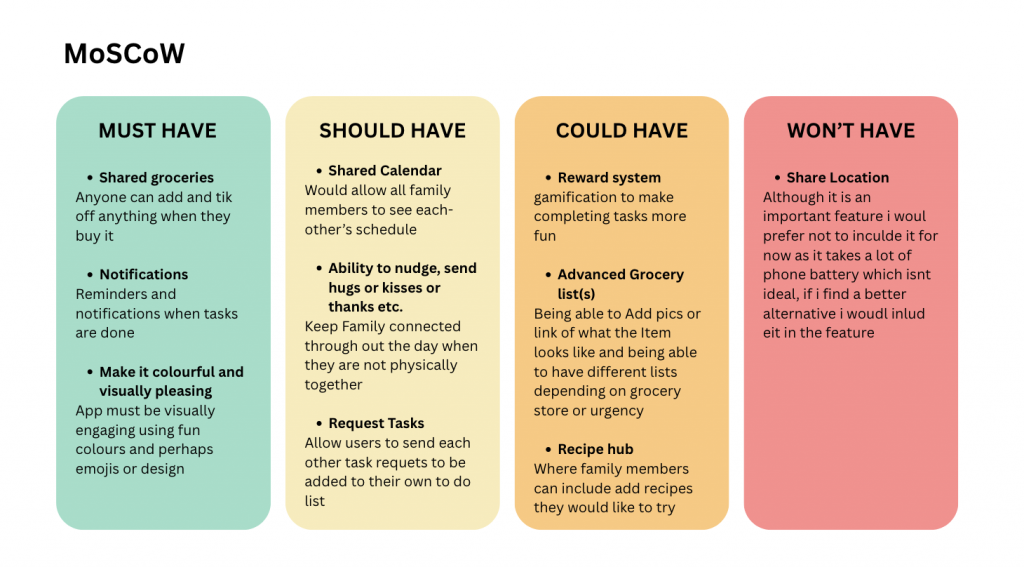
I used the MoSCoW
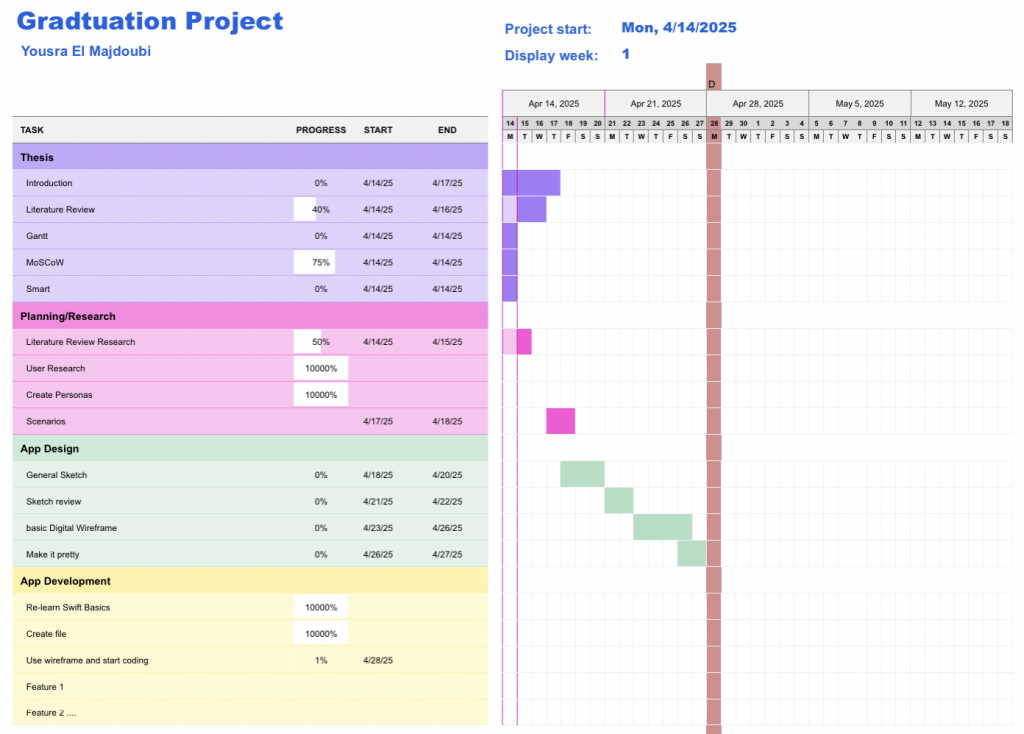
I created a new Gantt chart and adjusted the timeframe to fit the time I had left. Here’s the link to view my progress in real time: Book 8.xlsx
Leave a Reply